Transforming Raw Numbers into Visual Stories with Multiple Round Chart After Effects
Data surrounds every professional decision, yet the gap between a spreadsheet cell and a memorable insight remains wide. Motion designers and communicators have long turned to After Effects for its ability to blend precision with cinematic appeal, and the Multiple Round Chart After Effects template pushes this capability further. Instead of spending hours animating each arc or recalculating percentages, you can now deploy a pre-built system that respects your data while giving you full creative control. For anyone crafting quarterly reviews, training modules, or high-stakes marketing pitches, this approach turns flat metrics into a narrative that actually holds attention.
Why Static Visuals Are No Longer Enough
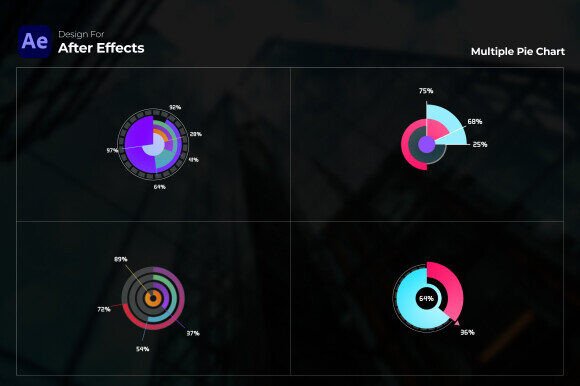
Audiences have grown accustomed to seamless transitions, subtle gradient shifts, and animated reveals in nearly every digital experience. A static pie chart in a slide deck might convey the numbers, but it rarely sparks curiosity. In contrast, a slowly unfurling round chart with a soft gradient from deep navy to electric blue cues the viewer that something worth watching is happening. The template's gradient style doesn't just look modern; it replicates the way our eyes naturally perceive depth and movement. When you show multiple data rounds in sequence, viewers subconsciously follow the flow, retaining more of the information.
More than aesthetics, this shift aligns with a broader behavioral trend: the rise of micro-storytelling. Whether in a 15-second social clip or a two-minute business report, people expect each data point to be introduced with intention. The Multiple Round Chart After Effects template supports that expectation by enabling you to present complex datasets without overwhelming the eye. Each round can represent a different category, time period, or departmental KPI, unfolding one after another so comparisons become instinctive rather than analytical work.
Gradient Aesthetics as a Trust Signal
Color psychology runs deep in professional communication. Flat, saturated tones can sometimes feel outdated or even aggressive, while carefully blended gradients project sophistication and technological freshness. The template’s gradient style isn't a decorative afterthought; it's a deliberate design choice that helps viewers distinguish segments at a glance. A gradient moving from warm coral to cool teal can label fiscal quarters without needing additional text, reducing cognitive load. For financial reports or sensitive data presentations, this subtle visual guidance builds credibility because it looks deliberate and polished, not cobbled together.
Creators who once spent hours tweaking color stops and opacity fades will appreciate that the gradient logic is already built in. You can adjust the starting and ending hues globally, and the template respects those choices across all rounds. That scalability means a marketer can maintain brand consistency across a product launch deck, while an educator can adapt the same template for different subject units without redoing the animation setup.
Handling Complex Data Without Losing Your Audience
The real test of any data visualization tool is how well it handles multiple data rounds. A single percentage breakdown is easy; three or five intertwined categories often become a visual mess. This template solves that by structuring rounds so they radiate from a central point, with each round maintaining its own clear segment hierarchy. As you input figures for employee engagement scores, market share breakdowns, or student performance metrics, the auto value calculation immediately recalculates slice angles and positions, letting you experiment with what the data actually says before locking in the final design.
Consider a regional sales dashboard destined for a board meeting. You might have four rounds: current quarter, previous quarter, same quarter last year, and variance target. The traditional approach demands exporting separate charts, aligning them in a video editor, and animating each one manually. With the Multiple Round Chart After Effects workflow, you load those four data sets, set a shared color key in the gradient panel, and let the template generate the animation. The result is a coherent whole where each round appears in sequence, drawing the board’s eye to both absolute values and trends.
Auto Value Calculation That Shortens Feedback Loops
Perhaps the most practical feature is the template’s ability to automatically update values the moment you enter new data. In a world where numbers change right up to a presentation deadline, this isn’t a luxury—it’s a necessity. If a colleague sends revised enrollment figures or updated campaign ROI stats, you no longer need to manually adjust slice angles or re-render multiple comps. You simply type the new numbers, and the chart reflects them instantly. This auto calculation preserves the precise geometry and rounded proportions that define infographic motion graphics, eliminating the risk of a 2% discrepancy that could undermine trust.
For freelance motion designers juggling multiple clients, this feature directly saves billable hours. Instead of quoting excessive time for chart revisions, they can offer competitive rates while still delivering a polished product. The user-friendly nature of this system also means that junior designers or interns can handle data updates without accidentally breaking the rig, while seasoned professionals can deep-dive into customization—tweaking timing curves, adding secondary animations, or overlaying callout text—without fighting the core logic.
Accessible to Beginners, Deep Enough for Pros
A common friction point with After Effects templates is that what’s advertised as “easy to use” often requires intricate knowledge of expressions or plugin dependencies. This template deliberately avoids that trap. It runs cleanly on After Effects CC 2023 and above, requires no third-party plugins, and comes with a free font link so you aren’t stuck with missing typefaces or unexpected purchase requirements. Opening the project, swapping placeholder data, and exporting a Full HD 1920×1080 clip can happen within minutes, which is crucial when a stakeholder requests a last-minute visual for a town hall.
The on-ramp for beginners is gentle, but the ceiling is high. Advanced users can dive into the comp structure to modify how rounds emerge, adjust the easing on the radial wipes, or nest the chart inside a larger infographic layout. Because it’s fully customizable, the template serves as both a rapid deployment tool and a skeleton for bespoke motion pieces. Many creators in the 20–50 age range straddle the line between do-it-yourself learning and professional execution; this template acknowledges that spectrum rather than forcing a one-size-fits-all mentality.
Where the Template Shines Across Industries
The application list provided—detailed business reports, comprehensive marketing presentations, educational and training videos, in-depth data visualization, annual and quarterly reports—isn’t just a feature list; it reflects emerging standards in each vertical. Let’s break that down.
Detailed Business Reports
Corporate strategists need to communicate operational efficiency or ESG metrics to stakeholders who may only glance at the screen for 20 seconds. An animated round chart that segments carbon footprint by facility with soft green gradients can communicate stewardship instantly, far better than a bar chart on a slide. The automation ensures that even last-minute data from a plant audit can be reflected without delaying the video export.
Comprehensive Marketing Presentations
Marketing teams frequently present funnel analysis, content performance, and audience segmentation. With multiple data rounds, a single composition can walk through top-of-funnel awareness, mid-funnel engagement, and conversion rates, all linked by a unifying color theme. The gradient style helps viewers track the same campaign across different rounds, turning a potentially dry metrics review into a story about customer movement.
Educational and Training Videos
Learning designers and corporate trainers know that retention increases when concepts are shown, not just spoken. A round chart illustrating the components of a healthy department—communication, autonomy, recognition, resources—can evolve as each element is discussed. The gradual reveal, powered by the template’s animation engine, keeps learners focused on the current point without distraction. Educators who are not After Effects experts can follow the straightforward data entry steps, while more tech-savvy colleagues can embed the final video into interactive e-learning modules.
In-Depth Data Visualization
Some projects demand a level of visual density that static infographics struggle to provide. Journalists, researchers, and policy analysts often need to illustrate survey results where multiple Likert-scale responses must be compared across demographics. The template can host a series of gradient rounds, each representing a demographic segment, with automatic scaling based on response percentages. This not only makes the data more digestible but also conveys the texture of public opinion more honestly than a single aggregated chart.
Annual and Quarterly Reports
Annual report videos have become a staple for modern organizations. The pressure to look professional while meeting tight publishing cycles is immense. Using a pre-rigged template like this, a communications lead can produce a sequence of financial highlights—revenue mix, expense breakdown, geographic contribution—that aligns with the annual report’s tone without waiting for a dedicated motion graphics team. The free font link further reduces friction, making brand compliance smoother.
Adapting to Modern Motion Design Workflows
Motion design teams are increasingly adopting component-based approaches, where reusable blocks of animation are combined like Lego pieces. The Multiple Round Chart After Effects template fits this paradigm perfectly. A studio might have a master project with multiple chart templates organized by style. When a client needs a round chart, the designer pulls this template, plugs in numbers, adjusts the gradient to the brand palette, and renders. This time-saving approach doesn’t stifle creativity; it redirects creative energy toward composition, typography, and narrative rhythm rather than repetitive keyframing.
Furthermore, the rise of remote collaboration means that project files must be self-contained and trouble-free. The fact that the template works without plugins eliminates the back-and-forth of “Which version of Saber are you using?” or “I don’t have Element 3D.” It drops cleanly into any CC 2023+ environment, making it an ideal asset for distributed teams where not everyone has an identical toolset.
Template Features That Solve Real Problems
Instead of listing bullet points in isolation, let’s consider how specific features address day-to-day pain points:
- Gradient style solves the inconsistency problem. Rather than struggling to apply harmonious colors across multiple chart rounds manually, you define the gradient once, ensuring visual unity across the entire animation.
- Multiple data rounds address the fragmentation issue. Presenters no longer need to jump between separate slides or video scenes; the entire comparative dataset lives in a single, coherent composition that transitions smoothly.
- Auto value calculation removes the risk of human error. When data changes, the charts recalibrate instantly, so you won’t inadvertently present outdated figures.
- User-friendly design bridges the skill gap. A marketing coordinator with minimal AE experience can deliver a data visualization that previously required a specialist.
- Free font link eliminates missing asset headaches. You can start working immediately without hunting for a compatible typeface.
- Time-saving is not just a buzzword. Real deadlines, multiple revisions, and high-stakes presentations demand tools that give back hours, not consume them.
These features don’t exist in a vacuum. They reflect a larger shift toward democratizing motion graphics. As expectations for video content rise across sectors, tools that reduce the technical barrier without sacrificing quality become essential. The template sits at the intersection of design automation and creative flexibility, which is exactly where today’s professionals need it to be.
Realistic Recommendations for Getting the Most Out of the Template
Start by collecting your data in a clean format. While the template auto-calculates, messy input leads to messy output. Lay out your categories and values in a spreadsheet first, then copy them into the template’s controls. Experiment with the gradient direction before finalizing; sometimes a radial gradient from center to edge creates a more organic feel than a linear one, especially when combined with a soft background.
For business reports, consider pairing the round chart with subtle typographic overlays that emphasize key numbers. Since the template is fully customizable, you can place callouts that animate in sync with each round’s appearance, reinforcing the spoken narrative. If you’re an educator, try slowing down the animation curve slightly to give learners time to absorb each segment, and use the gradient color to align with the module’s learning outcome categories.
Freelance motion designers can productize this offering. Include a round chart animation as part of a data-visualization package for clients, with pre-defined gradient presets that match common brand archetypes. Because the template works in Full HD, it suits everything from embedded website headers to large conference screens. Just ensure you communicate to clients that crisp 1920×1080 output is ready for any platform.
The Bigger Picture of Round Chart Motion Graphics
People pay more attention to data visualization in After Effects because the demand for motion content has exploded across LinkedIn, YouTube, corporate intranets, and live events. A static chart that once lived in a PDF now often needs to become a five-second animated clip for a video summary or a looping GIF for a newsletter. The Multiple Round Chart After Effects template is directly relevant because it enables that transformation without forcing creators to become full-time animators. It acknowledges that the person who understands the data best is often not the person who knows After Effects deeply—and it bridges that gap effectively.
Similarly, gradient-forward design is not a fleeting trend. It has become a staple of modern UI and motion design because it scales better across different screen luminances and adds a layer of visual richness without clutter. By baking this style into a practical template, the product aligns with what audiences now expect: clear, elegant, dynamic communication.
Whether you’re designing comprehensive marketing presentations, building educational and training videos, or crunching numbers for annual and quarterly reports, the right tool changes the nature of the work from a chore to an opportunity. The template’s ability to handle multiple data rounds with automatic recalculation, all wrapped in customizable gradients, makes it a worthy addition to any motion designer’s toolkit. Getting started is straightforward: open the project, set your data, adapt the visuals to your message, and render. In a landscape where clarity and speed often determine success, that efficiency matters.